SIMULATION MODELING OF SCHEMES OF CARGO TRUCKING BETWEEN EUROPEAN UNION AND CUSTOMS UNION
реклама
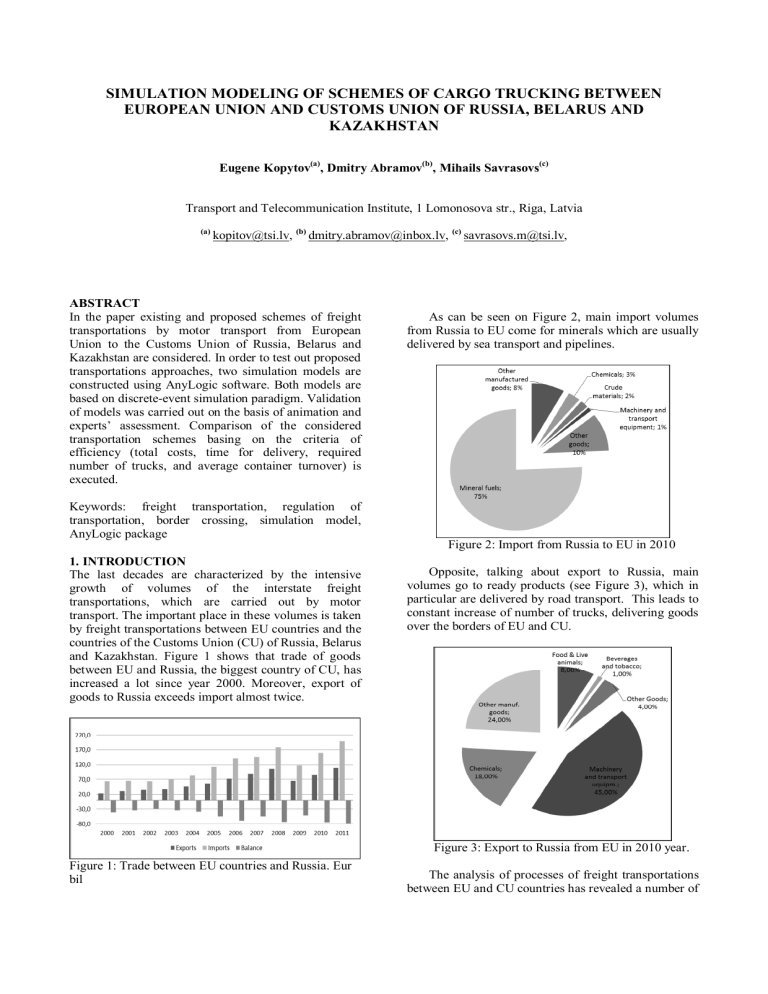
SIMULATION MODELING OF SCHEMES OF CARGO TRUCKING BETWEEN EUROPEAN UNION AND CUSTOMS UNION OF RUSSIA, BELARUS AND KAZAKHSTAN Eugene Kopytov(a), Dmitry Abramov(b), Mihails Savrasovs(c) Transport and Telecommunication Institute, 1 Lomonosova str., Riga, Latvia (a) [email protected], (b) [email protected], (c) [email protected], ABSTRACT In the paper existing and proposed schemes of freight transportations by motor transport from European Union to the Customs Union of Russia, Belarus and Kazakhstan are considered. In order to test out proposed transportations approaches, two simulation models are constructed using AnyLogic software. Both models are based on discrete-event simulation paradigm. Validation of models was carried out on the basis of animation and experts’ assessment. Comparison of the considered transportation schemes basing on the criteria of efficiency (total costs, time for delivery, required number of trucks, and average container turnover) is executed. Keywords: freight transportation, regulation of transportation, border crossing, simulation model, AnyLogic package 1. INTRODUCTION The last decades are characterized by the intensive growth of volumes of the interstate freight transportations, which are carried out by motor transport. The important place in these volumes is taken by freight transportations between EU countries and the countries of the Customs Union (CU) of Russia, Belarus and Kazakhstan. Figure 1 shows that trade of goods between EU and Russia, the biggest country of CU, has increased a lot since year 2000. Moreover, export of goods to Russia exceeds import almost twice. As can be seen on Figure 2, main import volumes from Russia to EU come for minerals which are usually delivered by sea transport and pipelines. Figure 2: Import from Russia to EU in 2010 Opposite, talking about export to Russia, main volumes go to ready products (see Figure 3), which in particular are delivered by road transport. This leads to constant increase of number of trucks, delivering goods over the borders of EU and CU. Figure 3: Export to Russia from EU in 2010 year. Figure 1: Trade between EU countries and Russia. Eur bil The analysis of processes of freight transportations between EU and CU countries has revealed a number of problems demanding the fast decisions. Among them there is a problem of improvement of freight transportations by motor transport through the border of EU and CU, which is investigated in the present article. Choice of the best cargo transportation scheme demands an estimation of effectiveness of proposed alternatives. While absence of statistics for a new transportation schemes, the estimation can be achieved by simulation modeling. Today simulation models are widely used when solving different tasks of cargo transportation (for instance, see McLean and Biles 2008; Parola and Sciomachen 2005; Rizzoli, Fornara and Gambardella 2002). These models have shown its effectiveness. Thus, simulation modeling method is a basic tool of the presented research. 2. REGULATION OF FREIGHT TRANSPORTATIONS BETWEEN EU AND CU COUNTRIES Road transportation between EU and CU has number of regulations. The main are agreements between two unions and bilateral agreements between the countries of CU and EU. Basing on these agreements, countries of the CU exchange with each EU country by special permissions for freight transportation between separate countries. There are two types of permissions: reusable and disposable. Generally transportations are carried out on the basis of the disposable permissions, operating between the concrete EU country and the country of CU. Their number exceeds the volume of the given-out reusable permissions many times, which mainly also allow to transport goods from 3-rd countries. Such permissions play a role of the regulator of transport quantity of definite country transporting goods between EU and the CU. Nearly every year the problem of shortage of number of these permissions is observed. The policy of the certain countries, including Russia, is directed to strengthening positions of its transportation companies on these routes. This affects the activity of transportation industry, accompanying and dependent industries, such as warehousing, customs and broker services, production, realization, etc. Year 2011, when there was a conflict between Russia and Poland which have the largest fleets of trucks in the countries of EU and CU, was especially indicative in this respect. The parties couldn't agree for the number of permissions, which are given out for year 2011, during a long time. The conflict lasted till April 2011 and led to decrease in deliveries of goods from EU to Russia. Another regulation comes from usage of TIR Carnets, which are emitted by local associations of carriers on behalf of IRU (The International Road Transport Union). “TIR” stands for Transports Internationaux Routiers (International Road Transport) and is an international customs transit system (IRU homepage 2013). TIR is an international system allowing goods to travel across one or more international border with minimal customs involvement. TIR is the only universal transit system that allows the goods to transit from a country of origin to a country of destination in sealed load compartments with customs control recognition along the supply chain. This minimizes administrative and financial burdens and customs duties and taxes that may become due are covered by an international guarantee. These regulations lead to the limitations of transport companies on the market. Companies, which are working on the local market of definite countries, cannot easily access international transportations. In peak seasons, when cargo volumes are growing along with demand for transportation services, cargo owners are suffering higher transportation rates, lack of free trucks, delays in deliveries, penalties and other issues. On the opposite side, the increase of trucks in such obstacles will not lead to the desired effect as during low periods trucks will just stand without cargoes. The task of improvement of the situation should be looked for in increase of effectiveness of cross-border cargo transportations. In terms of this task authors suggest to look into the conception of customs clearance and customs control of goods in the places closely located to the border of Customs union. This conception was introduced in Russia in 2008 (Federal Customs Service of Russian Federation). According to this concept construction of the large Customs and Logistic Terminals (CLT) within reach of the border is carried out, where customs clearance of goods and possible transfer of cleared cargo to the Russian carrier is being done. In the latter case it is necessary to use a single trailer (a body, a container platform, etc.) for trucks of the different countries which exchange trailers directly on the terminal. This conception is among main priorities of the Customs Authorities of Russia and has long-terms development plans till year 2020. Implementation of this freight transportation scheme should give the following main advantages: Avoid transportation basing on the TIR system; Switch to transportation mode when transport registered in this specific territory is working inside each Union, except special transportations; in this case necessity for registration of permissions disappears as in most cases foreign transport doesn't drive on the territory of each Union; Improve control after customs payments; Eliminate mass transportations of transit goods over the territory of CU, which will allow to reduce the volume of the illicit goods going on the markets of the countries of CU significantly; Decrease of lines at the borders; Improvement of border infrastructure and working conditions for the drivers; Quicker, easier and more transparent border crossing and customs clearance procedures. Evaluating of effectiveness of the proposed conception is the main goal of present research. 3. FREIGHT TRANSPORTATION SCHEMES BY MOTOR TRANSPORT FROM EU TO CU Let us consider two schemes of freight transportation by motor transport from EU to the CU: existing and proposed (perspective) schemes, on the example of containers’ transportation. The existing transportation scheme (ETS) is the standard scheme which is performed in most cases for containers moving from different ports like Riga (Latvia), Kotka (Finland), Klaipeda (Lithuania) and Tallinn (Estonia) to countries of Customs Union. To illustrate this scheme let us consider transportation of goods in containers from Riga to Moscow. According to standard scheme, cargo in container is arriving to the port of Riga. After unloading from vessel and passing all required customs formalities it is being loaded onto truck and delivered to the border of Latvia and Russia, which in fact is external border of European Union and Customs Union. After waiting in the line and passing customs border formalities, which can take more than one day, the truck with container is moving further to the customs terminal for customs clearance of transported goods. After performing the customs clearance, which usually takes about one day, the truck is moving to the warehouse of consignee for unloading. After unloading, which usually takes about half a day up to whole day, truck with empty container is moving back to port of Riga for dropping off the empty container. The considered transportation scheme involves several processes (Kopytov and Abramov 2011) which are described by a graph shown in the Figure 4. The arcs of the graph correspond to the processes and the vertices denote the start and the end of each process. Description of this graph (ETS) is presented in Table 1. A B C Company should have either admission to TIR Carnet system or should present special guarantees for customs authorities for payment of taxes in case of loss, steal or damage the cargo. Such conditions limit the number of trucks which perform international carriage of goods. In peak season this become a problem for the owners of cargo as demand for transportation services can exceed the offer. Another problem of this scheme, which emerges from time to time, is crossing the border between two Unions. Capacity of border crossing point is limited and during peak seasons big lines can emerge on the borders. For example, in separate months of year 2007 lines on the border between Latvia (LV) and Russia (RU) reached 2000 trucks. Proposed transportation scheme (PTS). In this respect a new approach to the transportation of goods, which is based on the concept proposed by Russia (see previous section), which is considering moving major customs clearance points to the borders, could become a good alternative. This approach is shown in Figure 5 and described in Table 2. The main idea here is that customs clearance of goods is being performed at the terminals, which are located directly at the borders and are like extensions of the border itself. This means that when truck is coming to the terminal, passing physical border line, it is still in neutral zone between two states. On this terminal all required actions for customs clearance can be performed. A B C E D D Figure 4: Existing cargo transportation scheme Table 1: Description of ETS graph Arc Process A-B Delivery of container from port of Riga to LV-RU border for checking by customs B-C Delivery of container from border to customs terminal in Russia C-D Delivery of container from customs terminal to warehouse for unloading D-A Delivery of empty container from warehouse back to port of Riga In order to perform such transportation, trucking company has to meet the following requirements: Company must have special permits for crossborder delivery; Figure 5. Proposed transportation scheme Table 2: Description of PTS graph Arc Process A-B Delivery of container from port of Riga to LV-RU border by LV truck B-C Delivery of container from LV-RU border to border customs terminal by LV truck C-D Exchange of container with cleared goods between LV and RU trucks D-E Delivery of container to warehouse for unloading by RU truck E-D Delivery of empty container to border terminal by RU truck D-C Exchange of empty container with cleared goods between RU and LV trucks C-A Delivery of empty container back to port of Riga by LV truck According to this scheme, cargo in container is arriving to the port of Riga. After unloading from vessel and passing all required customs formalities it is being loaded onto Latvian truck and delivered to the border of Latvia and Russia. After passing the border, which in this case takes several hours, the truck is going to the border terminal for customs clearance. After goods are cleared, the trailer with container is being changed from LV truck to RU truck and further delivered to the warehouse for unloading. After unloading the empty container is delivered to the border terminal by RU truck, thereafter trailer with empty container is being changed from RU truck to LV truck. On the final stage LV truck deliver the empty container to port of Riga for dropping off. The advantages of this scheme are the following: No special permits for cross-border delivery are required; No TIR Carnet admission is required (is not used); Border terminal adds capacity to the border crossing points; Enlarges the amount of transport units, which can perform transportations in order to avoid lack of transport during peak seasons. 4. SIMULATION MODEL DEVELOPMENT 4.1. AnyLogic Simulation Software As the model development tool AnyLogic simulation software was used (Emrich, Suslov and Florian 2007). AnyLogic software was developed and currently supported by AnyLogic company (earlier XJ Technologies). AnyLogic software first time was presented in Winter Simulation Conference 2000. Science this time AnyLogic become widely used software both by academic and business institutions. There are number of advantages, which make this tool suitable for development of the simulation models. These advantages could be enumerated: AnyLogic supports all the most common simulation methodologies (System Dynamics, Discrete Event, Agent Based modeling) and creates so called hybrid models (a number of simulation approaches are combined in one model); AnyLogic is implemented on base of the object-oriented model design paradigm; As the built-in language AnyLogic uses JAVA programming language; AnyLogic provides optimization build-in functionality, which is based on Java OptQuest™ optimizer from OptTek, Inc; AnyLogic allows to transform model into stand-alone JAVA application or JAVA applet; AnyLogic has a number of preinstalled libraries which cover all application areas (even such specific like traffic flow simulation, pedestrian flow simulation, etc.); Ability to construct 2D and 3D animation of the model; An extensive statistical distribution function set. All the mentioned above advantages provides flexibility during construction and experimentation with the model. 4.2. General Issues of Models Development In order to test out proposed earlier transportation schemes, two models were constructed by using AnyLogic simulation software. Both models are based on discrete-event simulation paradigm (Borshchev and Filippov 2004). The simulation models were developed in three stages: 1. 2. 3. Development of the ETS model which describes the existing technology, when container is loaded onto truck at the seaport, delivered to the place of customs clearance on the territory of CU, following which it is delivered to an unloading place. Development of the PTS model, which assumes usage of CLT located at the LV-RU border (from Russian side). According to this scheme containers are delivered from port to the border terminal by Latvian truck, thereafter a customs clearance of cargo is performed. Then cleared goods in the same container are taken out of the terminal by Russian truck, which in turn brings the empty container on the terminal. In this way containers are exchanged at the terminal. Development of graphic presentation of the model. Before detailed description of the constructed models a general parameters of the modeling should be provided (valid for both models): The time units in models are minutes; Simulation is based on real calendar. In order to develop more representative models a real calendar was used (with weekends and national holidays); Simulation period is 6 months. Both models have a big number of input parameters which were obtained from following sources: official statistical data, real observations, estimations provided by experts. All the input data could be divided on following categories, presented and described in Table 3 Both models have two types of entities implemented as JAVA Classes, the first one is Container and the second one is Vehicle, both are described in Table 4. Table 3: Model Parameters Groups Group Description Transportation Time spend to perform a time transportation from one geographical point to another (at example from Riga to Latvia-Russia border) Service time Time spend to provide a service by different service providers along transportation route (at example time spend on custom clearance) Schedule Schedule for service providers, which includes working hours, working days of week, national holidays (at example working hours for service provided by port of Riga in order to take out the container) Quantity of The quantity of the resources resources provided by service providers. (at example number of transportation vehicles or number of unloading gates in warehouse) Costs Different kind of costs which are summarized in total logistics expenditures during simulation Other All the parameters which are not included in the mentioned above categories like: Quantity of containers coming for transportation; The interarrival time between containers Vehicle Container Entity Table 4: Entities in models Parameter Type Description ID Int Internal identifier of the container inPortTime Double Time when container entered to the seaport inTranTime Double Time when container started to be transported ID Int Internal identifier of the vehicle inBlockTime Double Parameter used to estimate delay time in different blocks onBoardCont Container A container which is on board of vehicle 4.3. Model of “Existing Transportation Scheme” The first (base) model presents the first case of transportation organization: transferring of container by one vehicle. The general view of the ETS model is presented in Figure 6. Figure 6: The general view of the ETS model The description of the model shown in Figure 6 could be given part by part with additional comments on most important issues. The first part (see Figure 7) of the model simulates incoming process of the containers into port of Riga. Here standard blocks of AnyLogic are used. The issues which must be pointed out, that containers at the end are staked in queue block (portStorage), which represent a port storage place. The containers are stored in queue (portStorage) till the moment, when a vehicle for transportation will be available. Figure 7: The 1st part of the model (Container Arrival) The second part (see Figure 8) of the model describes loading process. In time zero a quantity (provided as parameter lv_vehicleNr) of vehicles are generated as entities. They are waiting in block queue (queueWaiting) till the time, when a container will be checked in event object (event1) every time unit, and in case of availability sets hold object (hold) in false available for transportation. Figure 8: The 2nd part of the model (Operations in Port) Further a service (servDocuments) block is used to simulate registration of documents for container transportation. Here a schedule (shedulePort) is used which takes into account working hours and working days. Next two blocks (queueLoading, loading) are used to simulate loading process of container into vehicle. Also must be noted, that vehicles coming back from the trip are going to the block queueWaiting and put empty container into containerStorage array. The third and fourth parts of the model (see Figure 9) present time spend to drive and pass border (LatviaRussia) and drive and pass customs. All these operations are simulated by using standard AnyLogic blocks. It must be noted that during driving it is taken into account, that driver will not drive by night (it is described by schedule blocks sheduleW2C). The custom operates also by schedule (sheduleCustom). why special attention will be put to the parts which significantly differs. Figure 11: The general view of the PTS model There is no difference between first, second and third part of the base and PTS model, so no additional description is required. The difference appears in the fourth part of the PTS model which is orientated on passing custom. The fourth part of the model is presented in Figure 12 in more details. Figure 9: The 3rd and 4th parts of the model (way and operations to border and custom) The fifth part of the model (see Figure 10) represents operations related to the way to warehouse, unloading in warehouse, and way back to Riga (including border passing). Here must be noted that warehouse is working according to the schedule provided in sheduleWarehouse blocks and the number of unloading gates is limited to 5. Figure 10: The 5th part of the model (unloading and way back) During container transferring different addendums of logistics expenditures are calculated, which include transferring costs and additional costs (like: container delay in port storage, additional costs related to custom passing, costs related with unloading process). 4.4. Model of “Proposed Transportation Scheme” The second model represents the logic described earlier: transferring of container is done by country and customs service is provided in border. The general view of the ETS model is presented in Figure 11. This model is extension of previously described base model; that is Figure 12: The 4th part of the PTS model (way and operations to border and custom) As could be seen in Figure 12, after passing the border vehicle with container must complete the customs clearance (block servCustom). On entering servCustom block new instance of dynamic event block CallVehicle will be created. This action is required in order to synchronize the movement between vehicles in Latvia and in Russia. After 900 minutes the request to send a vehicle (from Russian side) will be executed. The next block match is very important as it organizes the synchronization between vehicles from Latvian and Russian side. Having vehicles from Latvian and Russian side, it is possible to do exchange of the containers and continue transportation process (vehicles from Latvian side drive to the border and back to Riga, vehicles from Russian side drive to warehouse). The last part of the PTS model is focused on delivering of full container to warehouse. The detailed representation of this part of the model can be seen in Figure 13. It must be noted, that here, like in the ETS model, a parameter ru_vehicleNr is used in order to provide number of vehicles operating from Russian side. These vehicles as entities are generated in the simulation beginning by block sourceVehicleRU. Vehicles are waiting in block queueWaitingRU till the time they will be called (see the description of 4th part of the model), next they spend some time to reach the border (block way2terminal). Figure 13: The 5th part of the PTS model (way to warehouse and unloading) After exchange of containers vehicle performs transportation to the warehouse and unloading. During both procedures working hours and working days are taken into account by schedule objects (scheduleW2W and sheduleWarehouse). Next, after unloading vehicles drive back to the waiting queue (queueWaitingRU). 4.5. Calibration and Validation In order to be sure, that developed base (ETS) model is valid; the validation and calibration procedure was executed. As the main validation parameter a mean container trip time (a time from the moment when container started to be transported till the moment the empty container will be back) was used. The value of parameter was estimated during 10 runs of the model and after calibration of parameters results were accepted by experts as credible. During calibration mainly driving times between different geographical points were adjusted. The main tasks, which are fulfilled by the created models, are the following: 1. 2. 3. 4. To define quantity of trucks required for delivery of containers from port of Riga to final destination in Russia; To define costs for transportation of one container; To define transportation time; Basing on 3 criteria: transportation costs, number of required trucks and transportation time – to compare ETS and PTS models. 5. SIMULATIONS RESULTS 5.1. Existing transportation scheme This is the current solution for delivery of containers from Riga to Moscow via customs terminal. The truck is going from Riga via border, and then moving to customs terminal and to unloading. This is direct scheme when truck in loading the container at terminal and goes directly to unloading place via two major points: border and customs terminal. No reloading or changing trucks are supposed. The first step of the model is to find a minimum quantity of trucks for delivery of containers from port of Riga to the final destination in Moscow. Major criterion is processing of all incoming containers, so that no containers are left at seaport. After performing 10 experiments changing quantity of trucks, it was determined that 28 trucks are required for handling all incoming containers (see Table 5). Table 5: Quantity of trucks and unprocessed containers for ETS No of Quantity of Quantity of experiment trucks unprocessed containers 0 15 325 1 18 249 2 20 198 3 23 124 4 25 74 5 26 49 6 27 25 7 28 0 8 28 0 9 28 0 The next step for the ETS model is to determine total costs for transportations of all containers during simulation period basing on the results, obtained on previous step (quantity of trucks is 28). In order to reach the objective, 10 realizations have been done The results are shown in Table 6. Obtaining these results gives possibility to calculate mean and standard deviation of total transportation costs during 6 months, and cost for transportation of one container. From the obtained results we can see that mean and deviation of costs values is small and 10 realizations is enough for calculation. Table 6: Total costs for transportation for ETS No of Quantity of Total costs for realization delivered transportation, containers EUR 1 700 1 254 254 2 700 1 272 502 3 700 1 278 485 4 700 1 273 039 5 700 1 271 849 6 700 1 273 277 7 700 1 274 748 8 700 1 257 403 9 700 1 270 742 10 700 1 273 639 Mean Standard deviation Costs for transportation of one container 1 269 994 7 779 1 814 5.2. Proposed transportation scheme This is the proposed transportation scheme, when there are two “rings” and customs procedure between these rings. One ring is about 350 km from port of Riga to LV-RU border. Second ring is about 800 km from border terminal to warehouse in Moscow. At the terminal exchange of trailers between Russian truck head and Latvian truck head is performed. The first step of the PTS model is to find a required quantity of truck heads from each side, so that all containers are taken out of port of Riga to the final destination in Moscow. Major criterion is processing of all incoming containers, so that no containers are left at seaport. After performing 10 experiments, it was determined that 14 truck heads from Latvian side, 17 truck heads from Russian side and 31 trailers for exchange are required for handling all incoming containers. Summarized results are presented in Table 7. Table 7: Quantity of truck heads and unprocessed containers for PTS No of Quantity Quantity Quantity of experiment of truck of truck unprocessed heads in heads in containers LV RU 0 11 11 158 1 11 12 145 2 11 13 145 3 12 13 92 4 12 15 92 5 13 15 39 6 13 17 39 7 14 17 0 8 14 17 0 9 14 17 0 The next step for the PTS model is to determine total costs for transportations of all containers during simulation period basing on the results, obtained on previous step. In order to reach the objective, 10 realization have been done (see Table 6). Obtaining results gives possibility to calculate mean and standard deviation of total transportation costs during 6 months, and cost for transportation of one container. From the obtained results we can see that mean and deviation of costs values is small and 10 realizations in enough. Table 8: Total transportation costs for PTS No of Quantity of Total costs for realization delivered transportation, containers EUR 0 710 980 133 1 710 977 655 2 710 981 873 3 710 980 816 4 710 978 919 5 710 977 450 6 710 976 950 7 710 980 813 8 710 979 350 9 710 983 050 Mean Standard deviation 979 701 2 004 Costs for transportation of one container 1 380 In Table 9 final optimization results for both transportation schemes are shown. Having these results, it is possible to compare the current scheme ETS and proposed scheme PTS. The results of comparison ETS and PTS show that proposed scheme is more efficient in terms of transportation costs for one container, which decrease in 1,3 times. But ETS has one day better delivery time then PTS, which is not a big advantage as all containers are taken out of port. Besides, according to the PST more containers are returned back to the port of Riga. Talking about number of trucks, PST requires for 3 trucks more. But in middle and long-term perspectives, in terms of additional investments, this difference is not essential. Table 9: Criteria of efficiency of existing and proposed schemes Main criteria ETS PTS Transportation costs per one container Time for delivery of one container 1814 EUR 1380 EUR 6.5 days 7.5 days Required number of trucks 28 trucks 14 truck heads in LV 17 truck heads in RU 31 trailers Number of containers, delivered back to seaport 700 710 CONCLUSIONS Application of simulation method of freight transportations between two customs unions gives a researcher the convenient tool for an estimation of alternative freight transportation schemes for the various initial data, characterizing technical and economical indices of transportation system. In present research constructed models allowed comparing two different approaches to transportation, the existing scheme ETS and proposed scheme PTS using 4 main criteria: 1) loading all containers at seaport of Riga; 2) time for delivery of a container from loading till unloading; 3) required number of trucks; 4) transportation costs per one container. The results of comparison show that proposed scheme is more efficient in terms of transportation costs for one container. At the same time proposed scheme allows to switch from international transportations to national with less dependence on the external factors. Switching to new schemes also brings other advantages like relief of border crossing points from lines and increase of capacity without investing additional big funds into border infrastructure. REFERENCES Borshchev, A., Filippov A., 2004. From System Dynamics and Discrete Event to Practical Agent Based Modeling: Reasons, Techniques, Tools. In: Ed. M. Kennedy, G. W. Winch, R. S. Langer, J. I. Rowe, and J. M. Yanni. Proceedings of the 22nd International Conference of the System Dynamics Society, Oxford. Emrich, Sh., Suslov, S. and J. Florian, 2007. Fully agent based modellings of epidemic spread using AnyLogic. Proceedings of the 6th EUROSIM Modelling and Simulation Conference (EUROSIM 2007), Sept. 9-13, Ljubljana, Slovenia. Federal Customs Service of Russian Federation. http://eng.customs.ru/index.php?option=com_cont ent&view=article&id=71&Itemid=1848 [accessed 14 April.2013]. IRU homepage: About the TIR System. http://www.iru.org/en_iru_about_tir [accessed 10 May 2013] Kopytov, E., Abramov, D., 2011. Modelling of multimodal freight transportation system using process approach. Proceedings of the 13th International Conference on Harbour Maritime Multimodal Logistics Modelling and Simulation (HMS 2011), pp. 46–51, Sept. 12-14, Rome, Italy. McLean, A.A., Biles, W.E., 2008. Simulation-based optimization of a complex mail transportation network. Proceedings of the 2008 Winter Simulation Conference (WSC 2008), pp. 2577– 2588, Dec. 7-10, Miami, Florida, USA,. Parola, F., Sciomachen, A., 2005. Intermodal container flows in a port system network: Analysis of possible growths via simulation models. International Journal of Production Economics, 97, 75–88. Rizzoli, A.E., Fornara, N., and L.M. Gambardella, 2002. A simulation tool for combined rail/road transport in intermodal terminals. Mathematics and Computers in Simulation, 59, 57–71. AUTHORS BIOGRAPHY EUGENE A. KOPYTOV was born in Lignica, Poland and went to the Riga Civil Aviation Engineering Institute, where he studied Computer Maintenance and obtained his engineer diploma in 1971. Candidate of Technical science degree (1984), Kiev Civil Aviation Engineering Institute. Dr.sc.ing. (1992) and Dr.habil.sc.ing. (1997), Riga Aviation University. Professor (1998). Present position: Head of Computer Science Department of Transport and Telecommunication Institute, professor. Member of International Telecommunication Academy. Fields of research: statistical recognition and classification, modelling and simulation, modern database technologies. Publication: 290 scientific papers and teaching books, 1 certificate of inventions. His e-mail address is: [email protected] DMITRY ABRAMOV was born in Riga, Latvia and went to the Transport and Telecommunication Institute (TTI), where he studied Business Logistics and obtained his professional diploma in 2005. Master of Management Sciences degree (2007), TTI. Since 2007 PhD student, TTI. Was working at DB Schenker Latvia as Seafreigh Operation Manager and later Multimodal Traffic Manager from 2006 until the end of 2010. Currently occupies a position of Managing Director at Logotek Ltd. His e-mail address is: [email protected] MIHAILS SAVRASOVS was born in Daugavpils, Latvia and entered the Transport and Telecommunication Institute where he studied computer science and obtained the Master’s degree of Natural Sciences in Computer Science in 2006. Current position: Head of the Research Department in Transport and Telecommunication Institute, lecturer of Mathematical Methods and Modelling Chair and PhD student (Transport and Logistics programme). Fields of research: modelling and simulation. Publications: 25 scientific papers. His e-mail address is: [email protected]
