CWD and Postage Stamp modelling - Sensitivities Analysis v1 0 1
advertisement
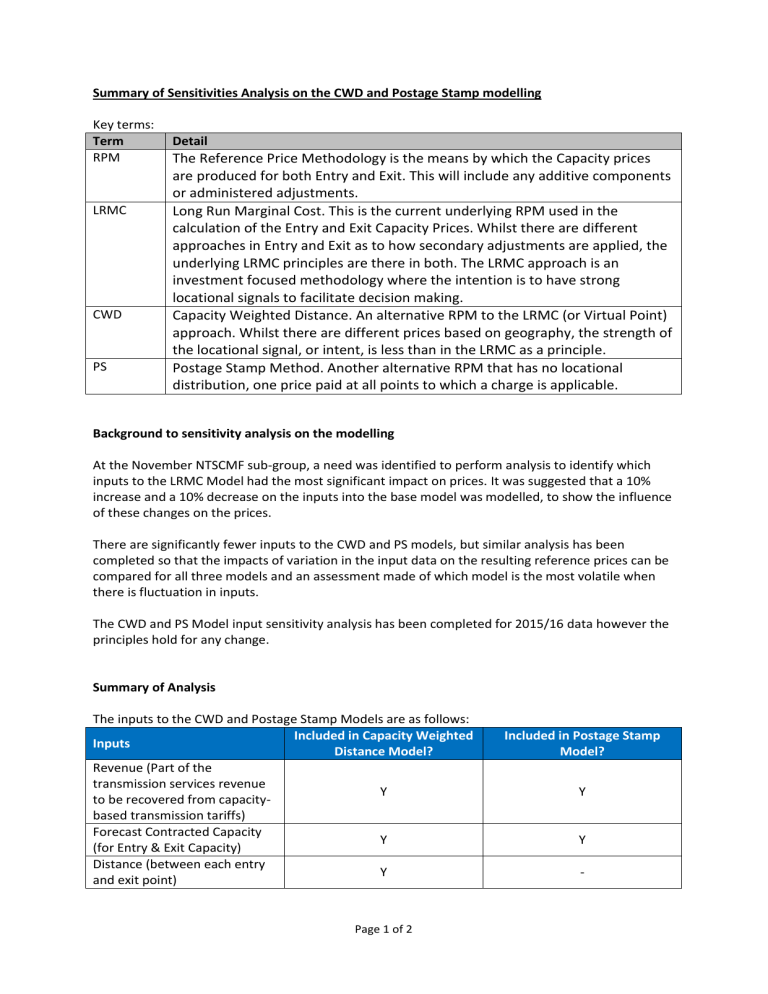
Summary of Sensitivities Analysis on the CWD and Postage Stamp modelling Key terms: Term RPM LRMC CWD PS Detail The Reference Price Methodology is the means by which the Capacity prices are produced for both Entry and Exit. This will include any additive components or administered adjustments. Long Run Marginal Cost. This is the current underlying RPM used in the calculation of the Entry and Exit Capacity Prices. Whilst there are different approaches in Entry and Exit as to how secondary adjustments are applied, the underlying LRMC principles are there in both. The LRMC approach is an investment focused methodology where the intention is to have strong locational signals to facilitate decision making. Capacity Weighted Distance. An alternative RPM to the LRMC (or Virtual Point) approach. Whilst there are different prices based on geography, the strength of the locational signal, or intent, is less than in the LRMC as a principle. Postage Stamp Method. Another alternative RPM that has no locational distribution, one price paid at all points to which a charge is applicable. Background to sensitivity analysis on the modelling At the November NTSCMF sub-group, a need was identified to perform analysis to identify which inputs to the LRMC Model had the most significant impact on prices. It was suggested that a 10% increase and a 10% decrease on the inputs into the base model was modelled, to show the influence of these changes on the prices. There are significantly fewer inputs to the CWD and PS models, but similar analysis has been completed so that the impacts of variation in the input data on the resulting reference prices can be compared for all three models and an assessment made of which model is the most volatile when there is fluctuation in inputs. The CWD and PS Model input sensitivity analysis has been completed for 2015/16 data however the principles hold for any change. Summary of Analysis The inputs to the CWD and Postage Stamp Models are as follows: Included in Capacity Weighted Inputs Distance Model? Revenue (Part of the transmission services revenue Y to be recovered from capacitybased transmission tariffs) Forecast Contracted Capacity Y (for Entry & Exit Capacity) Distance (between each entry Y and exit point) Page 1 of 2 Included in Postage Stamp Model? Y Y - The remaining two inputs, Revenue and Forecast Contracted Capacity, have been tested for each of the models by increasing them 10% and also decreasing them by 10% based on the original models (using the Obligated Entry and Exit Capacity Levels as the Forecast Contracted Capacity and the 2015/16 TO MAR (not including DN Pensions) from the Long Term Revenue Forecast Report). It would be inappropriate to test the impact of changing the Distances between points since sites cannot move their physical location. Test 10% decrease in Allowed Revenue 10% increase in Allowed Revenue 10% decrease in Forecast Contracted Capacity for each point 10% increase in Forecast Contracted Capacity for each point Impact on Capacity Weighted Distance Reference Prices 10% decrease in all reference prices 10% increase in all reference prices 11.11% increase in all reference prices Impact on Postage Stamp Reference Prices 10% decrease in all reference prices 10% increase in all reference prices 11.11% increase in all reference prices 9.0909% decrease in all reference prices 9.0909% decrease in all reference prices Since the models are the same for Entry and Exit, the changes in the inputs have identical effects on the Exit and Entry reference prices for each model. Revenue: For the references prices generated by the CWD Model and the PS Model an increase in the Revenue input will result in an increase by the same percentage in the reference prices. Similarly a decrease in the revenue input will result in a decrease by the same percentage in the reference prices. More specifically for a change in the Revenue by x% (where x can be positive or negative): 100 + 𝑥 𝑈𝑝𝑑𝑎𝑡𝑒𝑑 𝑅𝑒𝑓𝑒𝑟𝑒𝑛𝑐𝑒 𝑃𝑟𝑖𝑐𝑒 = ( ) 𝑂𝑟𝑖𝑔𝑖𝑛𝑎𝑙 𝑅𝑒𝑓𝑒𝑟𝑒𝑛𝑐𝑒 𝑃𝑟𝑖𝑐𝑒 100 Capacity: For the reference prices generated by the CWD Model and the PS Model an increase in the capacity input will result in a decrease in the reference prices by a similar proportion. Similarly a decrease in the capacity input will result in an increase in the reference prices by a similar proportion. More specifically for a change in the Forecast Contracted Capacity by x% (where x can be positive or negative): 100 𝑈𝑝𝑑𝑎𝑡𝑒𝑑 𝑅𝑒𝑓𝑒𝑟𝑒𝑛𝑐𝑒 𝑃𝑟𝑖𝑐𝑒 = ( ) 𝑂𝑟𝑖𝑔𝑖𝑛𝑎𝑙 𝑅𝑒𝑓𝑒𝑟𝑒𝑛𝑐𝑒 𝑃𝑟𝑖𝑐𝑒 100 + 𝑥 Conclusion Reference Prices generated by both the CWD Model and PS Model are impacted by fluctuations in the inputs; however the impact on Entry and Exit and across each location is identical and predictable. Version Control V1.0 Updated post 14.12.16 and 19.12.16 sub-group meeting and agreed at sub-group on 18.01.17 Page 2 of 2

